IDR | 03 Jun 2024

Public Health Wales gender pay gap narrows to 11.8% in 2022

Public Health Wales, the body responsible for protecting and improving health and wellbeing in Wales, has successfully narrowed its gender pay gap from 22.6% in 2017 (when the pay gap reporting regulations came into effect) to 11.8% in 2022.

According to analysis we conducted for Public Health Wales, the difference between male and female employees’ pay narrowed significantly in 2022. The overall gender pay gap based on average earnings for men and women fell by 4.3 percentage points since 2021 to stand at 11.8% in 2022. The average pay gap is calculated by taking all rates of pay for men and women, which includes both the lowest-paid and crucially also the highest-paid, and dividing the sum of these by the total number of male and female employees. Basing analysis on average earnings in this way, rather than focusing on the median, usually produces a larger pay gap since underrepresentation of women in higher-paying roles has the effect of lowering average pay for women.

The gap between median pay for male and female employees is smaller, since the median is less affected by outliers. At Public Health Wales the median pay gap also narrowed in 2022, falling from 8.5% in 2021 to 5.5% in 2022.

In many ways this narrowing of the gender pay gap in 2022 represents a continuation of an existing trend, which came about as a result of the various proactive efforts the organisation has been making to close the pay gap. These include advertising all job vacancies as being open to job sharers and part-time workers as standard; providing flexible working arrangements; and monitoring recruitment and selection processes, among other initiatives. All of these are felt to have had a positive impact.

Public Health Wales has a detailed understanding of its current gender pay gaps, having commissioned IDR to undertake an equal pay audit in Summer 2022. The organisation has been reporting its figures under the gender pay gap regulations but sought support from us to better understand the specific causes of pay gaps and also to obtain recommendations for narrowing these gaps, improving equality in the workplace and ensuring fair pay.

Our audit for Public Health Wales examined gender pay gaps by grade, department, length of service and age, and also explored how gender pay gaps interact and intersect with pay gaps for other protected characteristics under the Equality Act, including disability, ethnicity, religious status and sexual orientation.

If you require assistance with the various aspects of pay gaps: their accurate identification; analysis of the underlying issues; and solutions for dealing with these issues, get in touch with IDR at sales@incomesdataresearch.com or 01702 669549 

IDR | 03 Jun 2024

Pay gaps narrow or reverse for some ethnic groups according to the latest report from the Office for National Statistics

While gender pay gap reporting is compulsory for organisations of a certain size, ethnicity pay gap reporting – measuring the differences in average earnings between the reference group (usually White or White British employees) and a different ethnic group – is currently optional. This is due in part to the fact that ethnicity pay gaps (EPGs) are more difficult to analyse and report compared with gender pay gaps, as well as reluctance on the part of the government to impose additional reporting burdens on businesses.

Nonetheless, some employers have opted to do so, including the retailer Wickes, which recently published its first ethnicity pay gap report, with the mean ethnicity pay gap for 2023 standing at 0.04%. PRS for music also voluntarily publishes its EPG report and has done so for the past three years. The company’s mean ethnicity pay gap saw a drop of 2.7 percentage points from 2022 to 2023; it has attributed this decrease to the growing representation of ethnic communities internally. And the law firm Linklaters has reported a 5.5% mean ethnicity pay gap for 2023 a 0.4 percentage point increase from 2022.

The latest report from the Office for National Statistics (ONS) on ethnicity pay gaps shows that these remain an issue for some ethnic groups (under the five-category ethnicity breakdown used in this report, the ethnic groups are Asian or Asian British; Black, Black British, Caribbean or African; Mixed or multiple ethnic groups; White; and ‘Other ethnic group’, ie employees who do not identify with any other group). For example, median gross hourly pay for Black, African, Caribbean or Black British employees was £13.53 in 2022 compared with £14.35 for White employees, a gap that has persisted over the past decade. As the chart below shows, this is the only ethnic group to have consistently earned less than White employees since 2012.

Within ethnicity subgroups, it is evident that country of birth has a bearing on pay. UK-born Black, African, Caribbean or Black British employees have a pay gap of -6.5% compared to UK-born White employees. However, non-UK born employees have the widest pay gap – with Black employees born outside of the UK earning £2.23 an hour less than UK-born Black employees. This represents the widest pay gap (of 9.2%) relative to UK-born White employees. There is a similar narrative for Asian or Asian British employees born outside of the UK, who also experience a pay gap of 1.5% against UK-born White employees – a sharp contrast to the pay gap of -6.5% for those in the group born in the UK. 

To isolate the effects that ethnicity has on pay from those of other factors (such as occupation, geography, age or sex), the ONS has also estimated adjusted ethnicity pay gaps. As a consequence, in some cases pay gaps with UK-born White employees either narrowed or reversed. For example, before adjusting for factors such as occupation or location, UK-born Asian or Asian British employees earned an average of 11.9% more than UK-born White employees. However, based on the adjusted calculation they in fact earned 1.9% less. Similarly, UK-born Black, African, Caribbean or Black British employees move from earning 6.5% more to earning 5.6% less compared with White employees.

As can be seen in the chart above, from being the lowest-earning ethnic group from 2012 to 2019, the ‘Other ethnic group’ group has reversed this trend in recent years and become one of the highest-earning ethnic groups. However, this change is less pronounced when looking at the adjusted pay gaps, which suggests that this change might be attributable to differences in characteristics. For example, 77.8% of the ‘other’ group work full time and 75.5% of this ethnic group work in the private sector – 1.2 and 3.8 percentage points greater than White employees respectively. Changes in the composition of this category (which in the 2021 Census included respondents who cited their ethnic group as Kurdish, Hispanic or Arabic, among others) over time may also have contributed to the reversal.

Employers who want to improve their understanding of ethnicity pay gaps in their organisation could look to the guidance published by the government last April, which is intended to ‘give employers the tools to understand and tackle pay gaps within their organisations and build trust with employees’, as well as promoting greater consistency in reporting, on a voluntary basis. 

IDR | 03 Jun 2024

What is the Gender Pay gap?

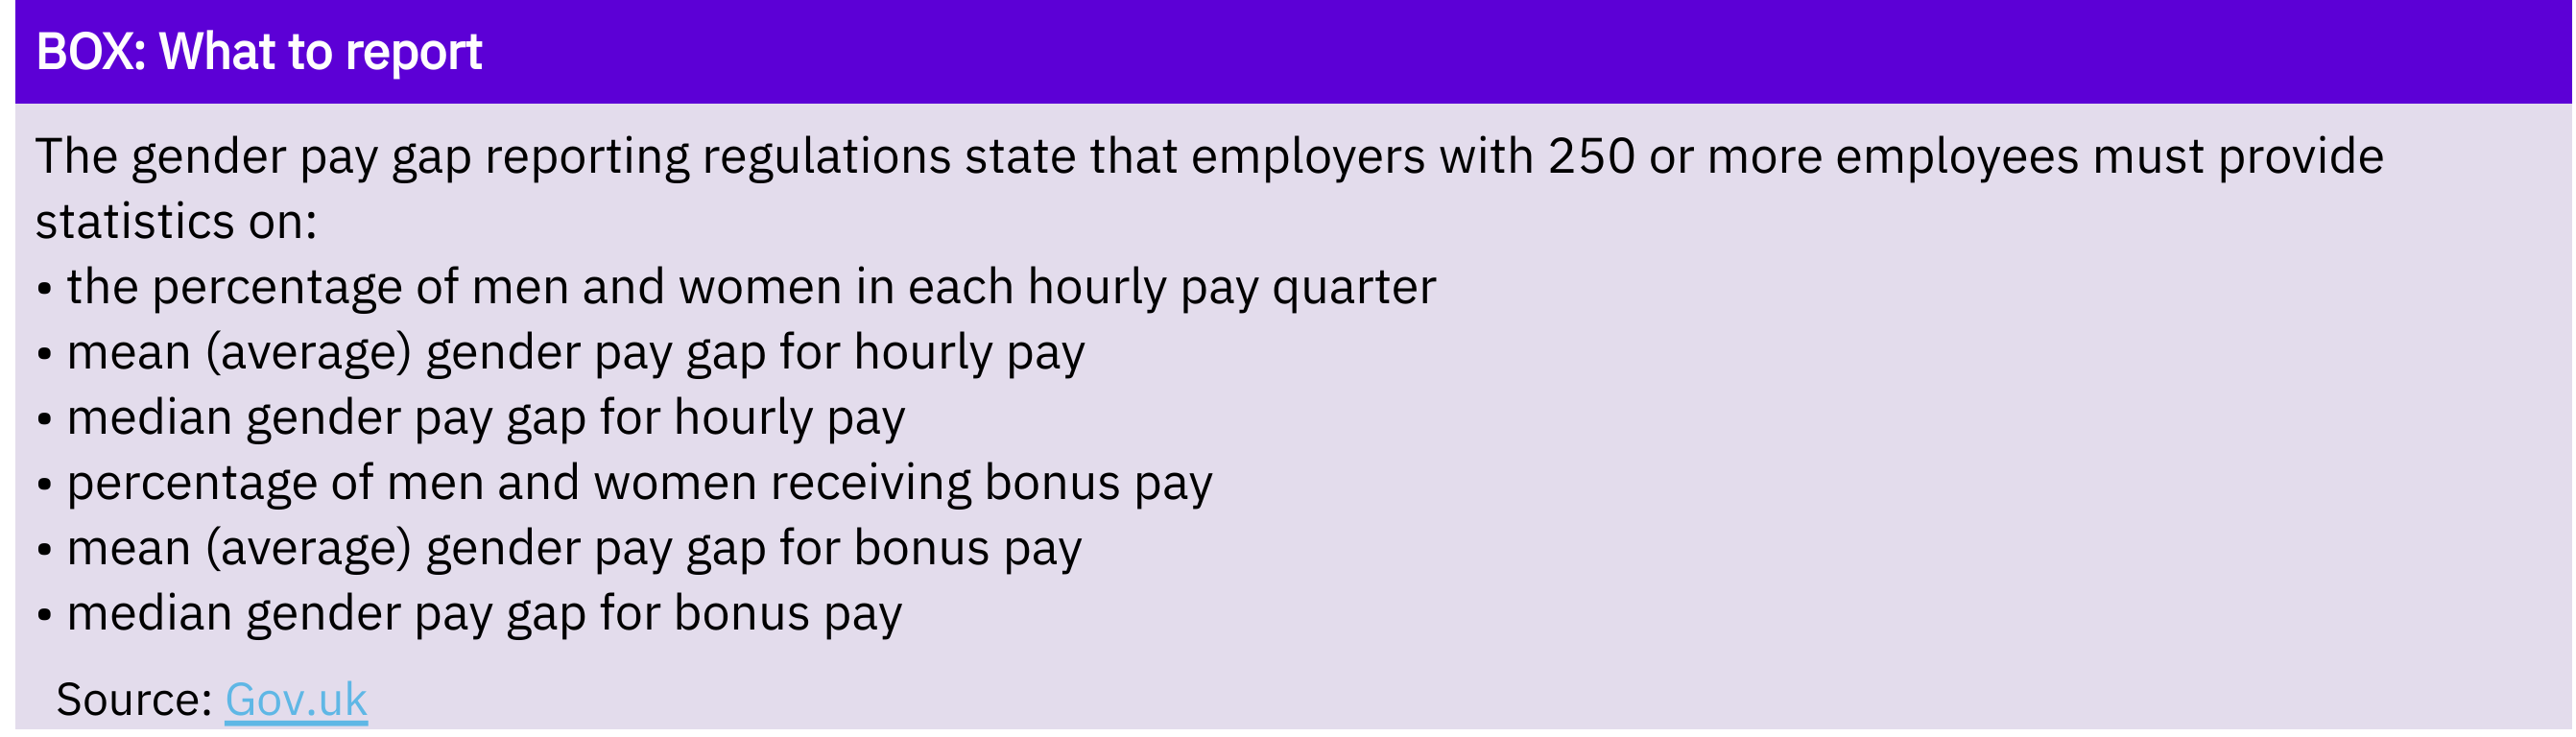
As firms begin to prepare their gender pay gap information and get ready to provide key statistics under the statutory reporting regulations, IDR considers what each of the statistics measures and the insights they provide for employers.

Gender pay gap

The gender pay gap is a simple calculation that takes an average measure of pay for female employees and compares it to that for male employees. The difference is expressed as a percentage of men’s pay. For example, if an organisation has a gender pay gap of 11%, this means that on average, women’s pay at the organisation is 11% less than men’s. The gender pay reporting regulations require employers to base gender pay gap calculations on hourly ordinary pay for 'full-pay' employees employed on the snapshot date. ('Full-pay' employees are either paid their usual full basic pay – including paid leave – or paid for piecework during the pay period in which your snapshot date falls, or paid less than their usual basic pay or piecework rate, but not because of leave - for example, because they have irregular working hours.) ‘Ordinary’ pay is defined as gross regular pay before any deductions for tax or National Insurance but after salary sacrifice. For most employees this includes basic pay, shift pay and fixed allowances.

Employers must calculate the gap based on both average (mean) and median earnings. The median pay gap is generally smaller since it takes pay for the middle male or female employee when lined up in order from smallest to largest earnings and is subsequently less affected by very high or low earners in the sample. The average by contrast adds all the pay rates for male or female employees and divides this by the total number of employees and therefore the result can be affected by outliers. Generally, where firms have large average pay gaps this is usually due to a small number of very highly-paid men pushing up the average measure of pay for male employees.

The main issue with the headline pay gap statistic is that it is a relatively crude measure which tells us nothing about the possible reasons for differences in pay for men and women. To understand this employers need to analyse pay gaps for similar cohorts of employees, for example by grade or age. At present the regulations do not require this level of detail, but this could change in the future.

Pay quarters

The pay gap reporting regulations also require firms to publish the number of male and female employees in each pay quarter. To do this employers list all employees from highest to lowest pay and divide the list into quarters, followed by calculating the number of male and female employees with earnings in each quarter. This approach provides employers with more detailed information about the earnings distribution. The largest pay gaps tend to be found in organisations where women make up the majority of staff in the lowest-paid quarter and men make up the majority in the highest pay quarter. Analysis of the earnings distribution like this can be useful for identifying where women are underrepresented and helping employers take steps to improve the numbers of women in more senior roles.

Bonus payments

Employers are also required to publish the proportion of men and women in receipt of bonus payments, where relevant. This figure can indicate whether gender bias exists in decision-making over bonuses. However, further analysis by grade is often necessary as the headline figure could be affected by the types of roles in which men and women are employed, rather than discrimination per se. For example, certain male-dominated roles (such as in banking) tend to attract bonus pay more frequently than some female-dominated roles (such as those in clerical, caring, catering and cleaning work). At the same time, understanding of the operation of bonus schemes, and the criteria governing access and amounts, is also important. 

Understanding pay gaps

As outlined above the statistics required from the current pay reporting regulations alone are not enough to understand the cases of pay gaps, however, and that the Government and other bodies have also emphasised the importance of organisations providing a written narrative. This is central to understanding and explaining the reasons for any gaps and for setting out action plans to address their root causes.